Where the Willing Can’t Help: How States Stack Up on Family Caregiver Support
Every year, Americans search online for information on how to become a paid caregiver. However, their willingness to help is met with a broken system. This report reveals which states are best—or worst—at turning caregiver willingness into real, sustainable support.
Where the Willing Can’t Help: How States Stack Up on Family Caregiver Support
Table of Contents
Introduction: A Crisis of Good Intentions
Best and Worst States for Caregivers & Their Loved Ones
Full Data: Top 5 States for Caregivers & Their Loved Ones
Full Data: Bottom 5 States for Caregivers and Their Loved Ones
California Caregiving Report Card
Waitlist Inequality: Which States Are Failing—and Which Are Leading—on Access to In-Home Support
Senior Fall Rates: How Prompt and Accessible Care Helps
Where Caregiving Pay Makes the Biggest Impact
Introduction: A Crisis of Good Intentions
Introduction: A Crisis of Good Intentions
Across the United States, families are eager to step in and care for aging or disabled loved ones. Every year, Americans search online over 1 million times for information on how to become a paid caregiver—a reflection of both growing need and personal commitment. But far too often, their willingness to help is met with a broken system: long waitlists, minimal compensation, bureaucratic barriers, and no path forward.
This report reveals which states are best—or worst—at turning caregiver willingness into real, sustainable support. Using a range of data points—including search interest, Medicaid waitlist sizes, caregiver pay, median income, and rates of senior falls—we’ve ranked states to show where the system supports caregivers, and where it’s failing them and the vulnerable people they’re trying to protect.
Why This Matters
More than 53 million Americans provide unpaid care to a loved one, according to AARP. Most do so with no formal training, no pay, and no access to state programs that could help. Studies consistently show that unpaid caregivers experience higher rates of:
- Depression and anxiety (over 40% report clinical symptoms)
- Financial hardship (with an average of $7,200 in out-of-pocket costs annually)
- Job loss or reduced hours (especially among women)
- Chronic health issues, including hypertension and sleep disruption
At the same time, nearly 1 in 4 older Americans falls each year—often due to lack of consistent assistance, care or supervision. When the system blocks families from stepping into a caregiving role, the consequences ripple outward: increased emergency hospitalizations, higher state Medicaid costs, and diminished quality of life for both caregivers and care recipients.
This study is a call to action. Below, we break down which states are succeeding—and which are leaving caregivers stranded.
Key Findings
Key Findings
- High Public Interest: Americans search over 1 million times per year for how to become a paid caregiver—signaling strong willingness to help.
- Access to Care Varies Widely:
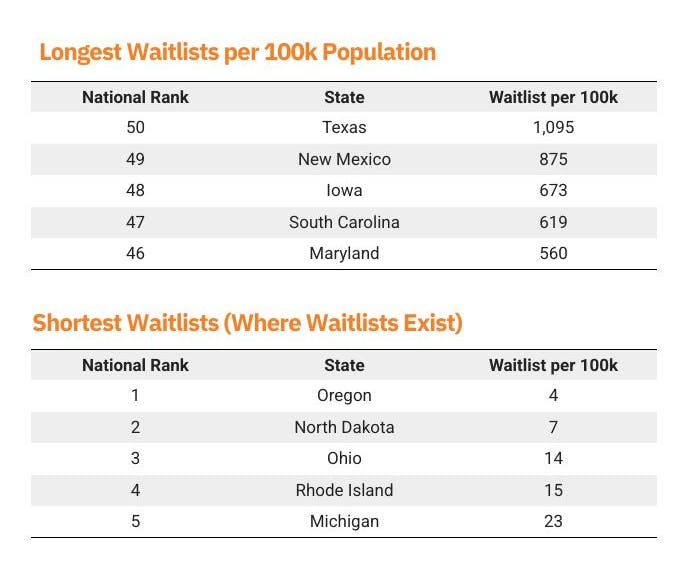
– California has one of the nation’s shortest waitlists for home care (23 per 100K residents).
– Texas ranks last, with 1,095 people per 100K residents waiting for services—over 5x the national average. - Fewer Waitlists, Fewer Falls:
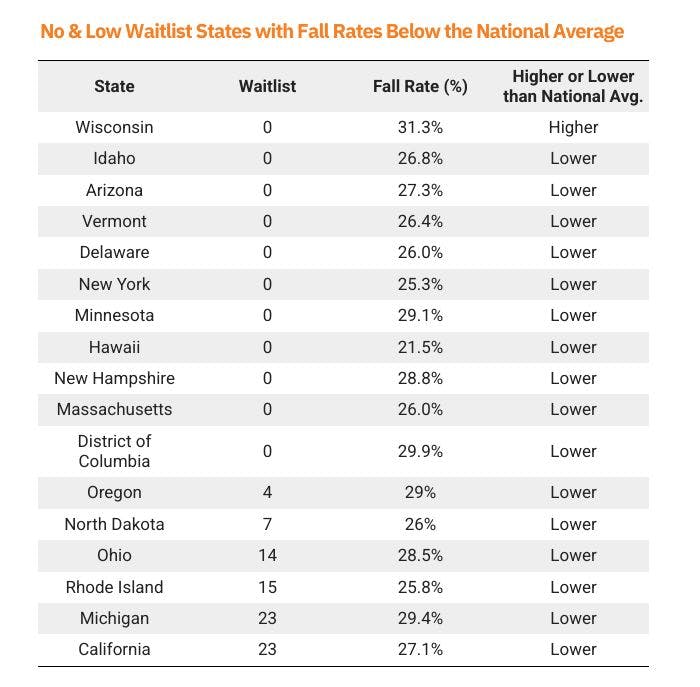
– States with no waitlists and lower-than-average fall rates include Hawaii (21.5%), Vermont (26.4%), and New York (25.3%).
– States with long waitlists and high fall rates include New Mexico (33.4%) and Iowa (30.4%). - Caregiver Pay Could Ease Financial Strain:
– In Mississippi and Louisiana, adding part-time caregiver wages would raise household income by over 27%.
– In higher-income states like Utah and Maryland, the income boost is below 19%.
Top States Support Caregivers Well:
– New York, North Dakota, Vermont, Hawaii, and Illinois rank highest overall, with strong pay, short waitlists, and better health outcomes. - Bottom States Fall Short Across Metrics:
– Texas, Florida, Utah, Iowa, and Maryland show long delays, low wages, and limited caregiver support. - California Balances Strength and Strain:
– Ranks 8th nationally for waitlist access
– Pays caregivers $18,288 annually—slightly above the U.S. average
– Reports 1.44 million senior falls each year, showing the scale of unmet care needs
Best and Worst States for Caregivers & Their Loved Ones
Best and Worst States for Caregivers & Their Loved Ones
We created a composite score for each state based on four equally weighted factors:
- Shorter HCBS waitlists (per 100K residents)
- Lower fall rates among older adults
- Higher caregiver compensation
- Greater percentage income boost for households from caregiving wages
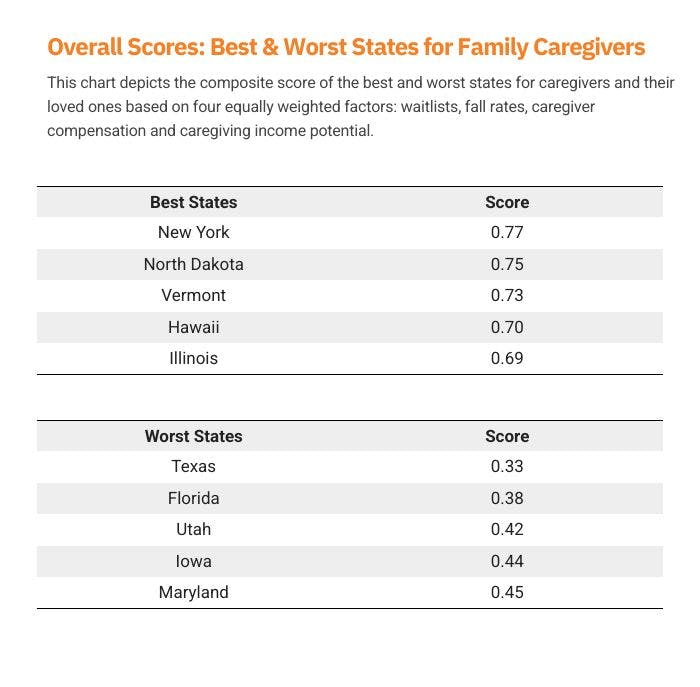
Top-performing states like New York and Vermont have invested in robust in-home care systems. They maintain short waitlists, offer competitive pay, and see fewer falls among seniors.
Texas and Florida, despite large senior populations, show long delays in care access and lower relative caregiver support—pressuring families to do more, often without help.
Full Data: Top 5 States for Caregivers & Their Loved Ones
Full Data: Top 5 States for Caregivers & Their Loved Ones
1. New York
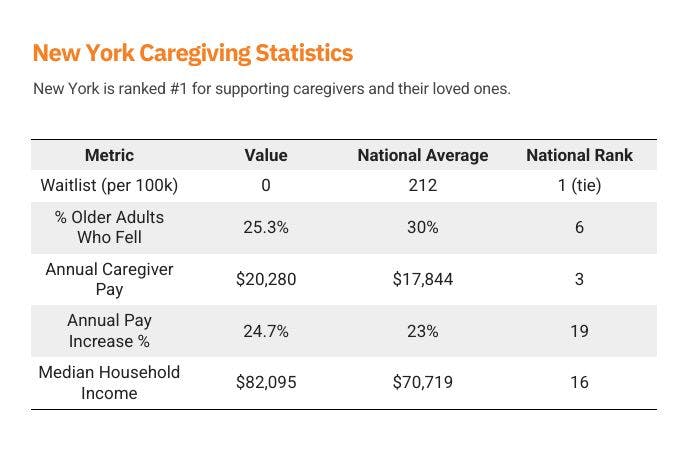
New York sets a high standard for caregiving support, combining zero waitlists for HCBS services with some of the highest caregiver wages in the country. Through its Consumer Directed Personal Assistance Program (CDPAP), the state empowers families by allowing them to select and compensate caregivers of their choosing—including relatives—creating both flexibility and economic stability. With a fall rate well below the national average and caregiver pay exceeding $20,000 annually, New York's approach reduces strain on the healthcare system while keeping seniors safely at home. The state’s relatively high median income further enhances the financial viability of caregiving, positioning New York as a national leader in aging-in-place policy and family caregiver support.
2. North Dakota
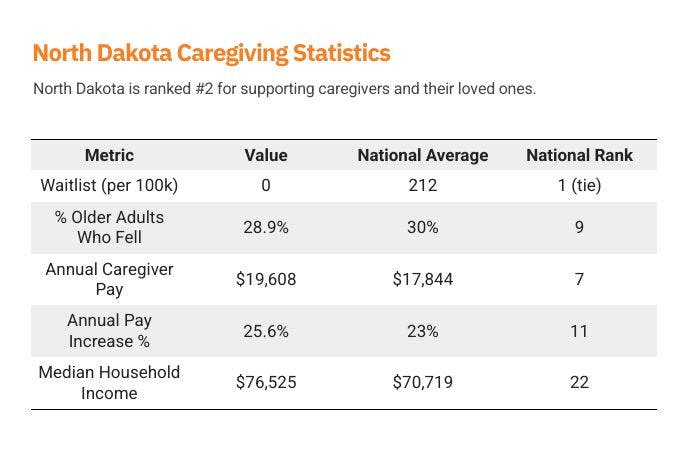
North Dakota ranks among the most caregiver-friendly states, with zero individuals on its HCBS waitlist and above-average pay for caregivers. The state's Family Paid Caregiver Pilot Program stands out as a proactive model, allowing family members to be compensated for care—an especially valuable policy in North Dakota's rural communities, where access to professional home care services can be limited. With caregiver wages nearly 10% higher than the national average and a strong annual wage growth rate, North Dakota not only values caregiving work but helps make it financially viable. While the state's median household income is slightly below the national average, the supportive infrastructure for in-home care makes a meaningful impact on both seniors and those who care for them.
3. Vermont
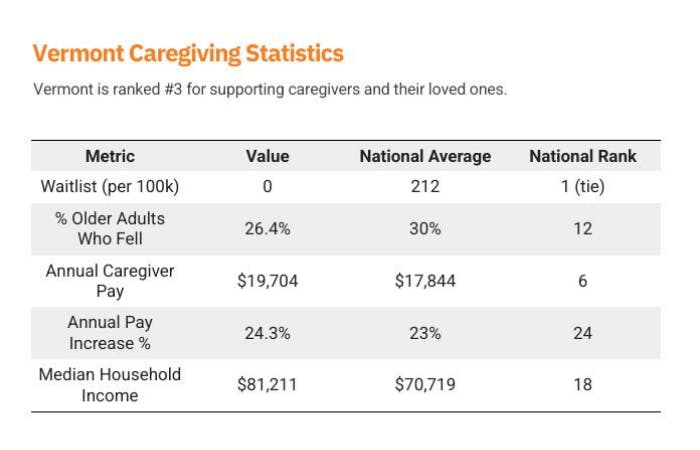
Vermont’s Choices for Care program exemplifies a commitment to equitable, community-centered elder care. By maintaining no waitlists for high-need individuals, Vermont ensures that residents can access home- and community-based services without delay—crucial in a state with a rapidly aging population and significant rural regions. Caregivers in Vermont earn above-average wages and enjoy a strong level of job stability, thanks to the state’s supportive policies and consistent wage growth. With a low fall rate among older adults and a household income that surpasses the national average, Vermont effectively reduces both health risks and financial strain for caregiving families. Its model underscores how smaller states can lead in delivering dignified, at-home care without bureaucratic barriers.
4. Hawaii
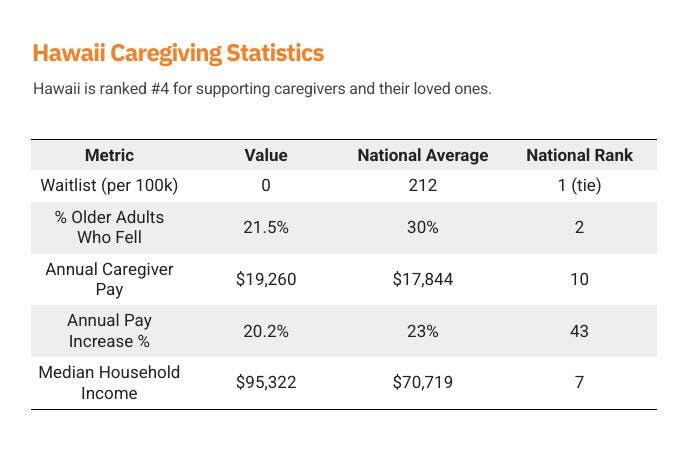
Hawaii stands out as a top-performing state for senior care, combining no waitlists, high caregiver pay, and the second-lowest fall rate among older adults nationwide. The state’s Aging and Disability Resource Center (ADRC) plays a central role in coordinating services, offering caregivers streamlined access to resources, education, and financial support. While the annual pay increase for caregivers lags behind other states, Hawaii’s strong baseline wages—paired with a median household income well above the national average—help mitigate financial pressure. The exceptionally low rate of senior falls points to the success of Hawaii’s community-based approach, where culturally rooted caregiving practices and formal support systems work in tandem to keep older adults safe at home.
5. Illinois
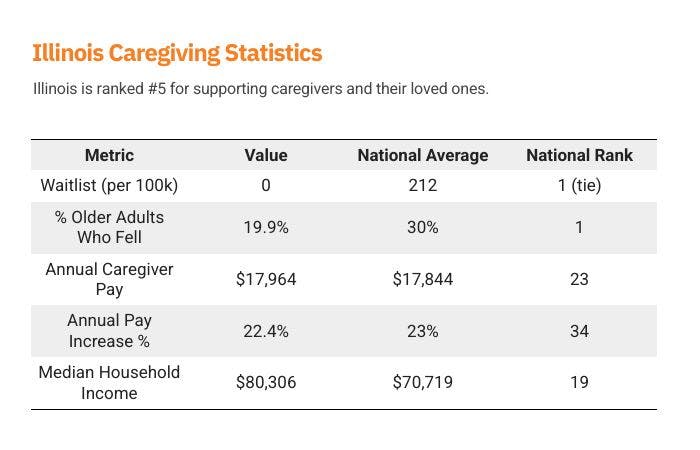
Illinois leads the nation in one of the most critical indicators of senior well-being: it has the lowest reported fall rate among older adults at just 19.9%, significantly below the national average of 30%. This achievement, combined with zero HCBS waitlists, reflects a strong infrastructure for in-home support and preventive care. While caregiver pay in Illinois is close to the national average, and wage growth is slightly below average, the state’s emphasis on accessible services appears to be paying off in health outcomes. With a median household income above the U.S. average, Illinois strikes a meaningful balance—ensuring timely access to care and reducing health risks for aging residents. Its performance demonstrates that even modest caregiver wages can go further when coupled with effective, coordinated care delivery.
Full Data: Bottom 5 States for Caregivers and Their Loved Ones
Full Data: Bottom 5 States for Caregivers and Their Loved Ones
1. Texas
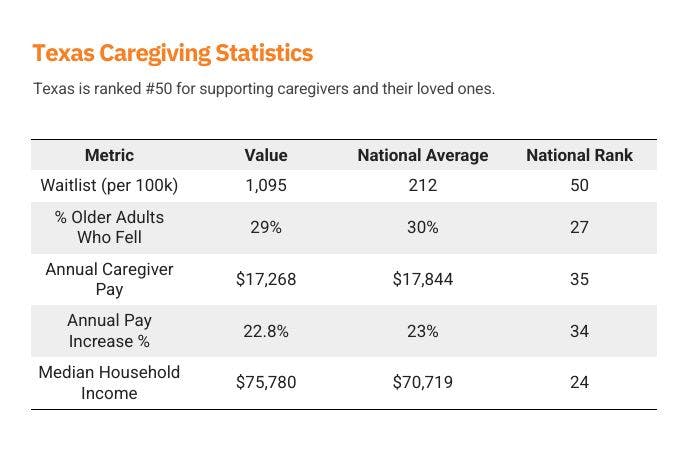
Texas faces some of the most severe caregiving challenges in the country, ranking dead last for HCBS waitlist length with over 1,000 individuals per 100,000 residents waiting for services—five times the national average. This backlog leaves families without timely access to support, often forcing them to shoulder the burden without compensation or formal training. While the state’s caregiver pay is only slightly below the national average, wage growth remains sluggish, and the fall rate among older adults is higher than in many peer states, indicating gaps in preventative care. With a median household income below the U.S. average, many Texans struggle to afford private alternatives while waiting for Medicaid coverage. Without major investment in its long-term care infrastructure, Texas risks deepening the strain on both unpaid caregivers and vulnerable seniors.
2. Florida
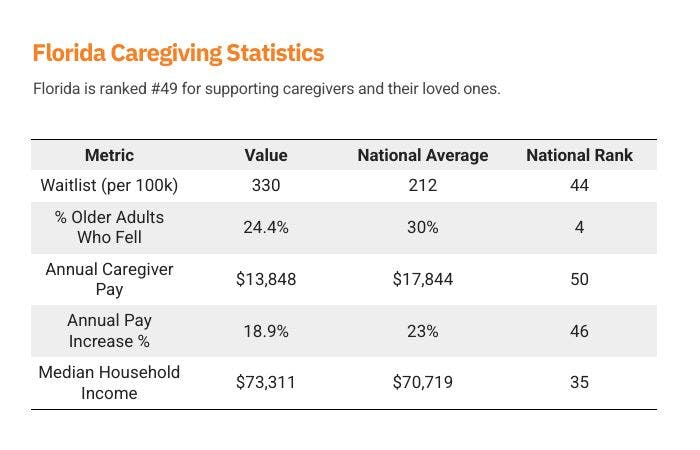
Florida is home to one of the largest senior populations in the country, yet its support for caregivers significantly lags behind. The state ranks last in caregiver pay, offering just $13,848 annually—far below the national average—while also placing in the bottom five for annual wage growth. This inadequate compensation, paired with a waitlist well above the national average, places enormous pressure on families trying to care for aging loved ones. While Florida performs well on fall prevention—with one of the lowest senior fall rates in the nation—the lack of robust financial and systemic support for caregivers threatens the sustainability of that success. With a median household income also below average, many families find themselves unable to bridge the gap with private services, making state-supported caregiving programs all the more essential.
3. Utah
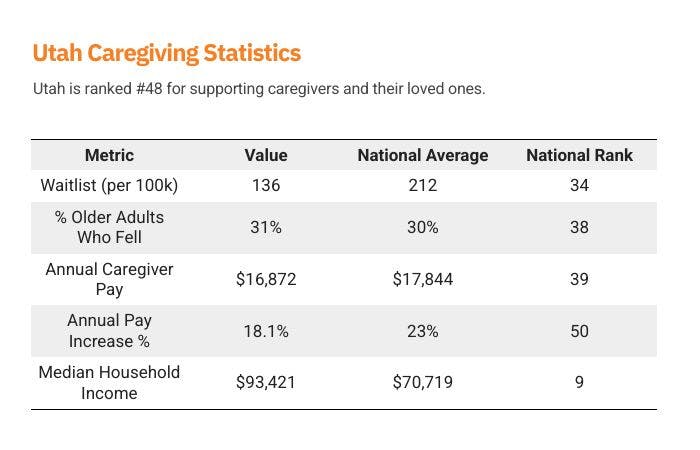
Utah presents a stark contrast between strong household earnings and weak caregiver support. Despite a median household income nearly $16,000 above the national average, caregiver pay is well below average at just $16,872 annually. That disparity makes Utah one of the worst states in terms of caregiver compensation relative to overall income, signaling a lack of prioritization for in-home care work. To make matters worse, Utah ranks last in the nation for annual caregiver wage growth, limiting long-term financial viability for those in the profession. The state's above-average fall rate among older adults also raises concerns about the adequacy of in-home care access and quality. While Utah’s HCBS waitlist is shorter than the national average, low compensation and wage stagnation suggest that families—especially those providing unpaid care—may be absorbing a disproportionate share of the burden.
4. Iowa
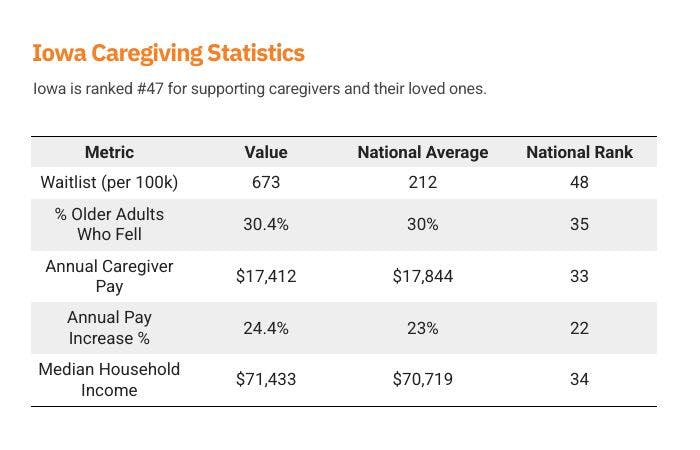
Iowa ranks among the lowest-performing states for caregiving access, with one of the longest HCBS waitlists in the country—673 people per 100,000 residents are waiting for services, more than triple the national average. This prolonged delay places an unsustainable burden on families, particularly in rural areas where alternative options are limited. While caregiver pay is slightly below average, Iowa’s wage growth is strong, suggesting modest improvements over time. However, that growth hasn’t yet closed the gap for caregivers struggling to make ends meet—especially in a state where the median household income is well below the national average. Compounding the issue, Iowa’s senior fall rate is slightly above average, pointing to potential gaps in preventive care and home safety support. Without targeted reforms, many Iowa families may continue to face both financial strain and avoidable health risks while waiting for help to arrive.
5. Maryland
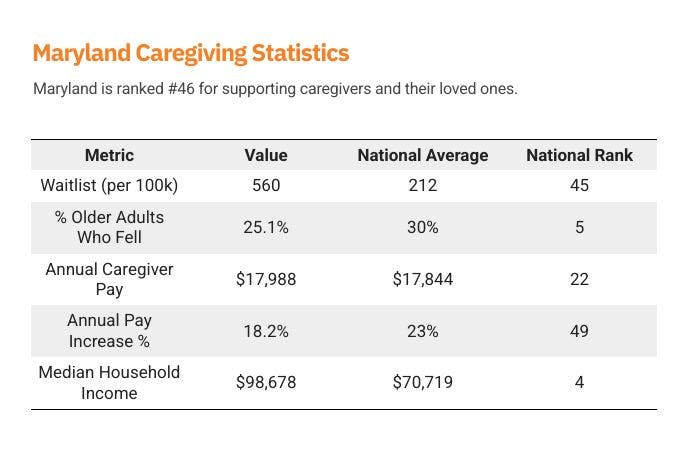
Maryland presents a mixed picture for caregivers and their loved ones. On one hand, the state boasts a high median household income—the fourth highest in the nation—and a senior fall rate well below the national average, suggesting relatively strong public health infrastructure. On the other hand, Maryland struggles with one of the longest HCBS waitlists, with 560 people per 100,000 residents awaiting services. This delay can significantly impact families who rely on timely access to home-based care, particularly those who cannot afford private alternatives. Caregiver pay is slightly above average, but wage growth is among the lowest in the country, making caregiving a financially stagnant career path despite the state’s overall affluence. For Maryland to fully support its aging population, it must pair its strong income base and health outcomes with faster access to services and better long-term compensation for caregivers.
California Caregiving Report Card
California Caregiving Report Card
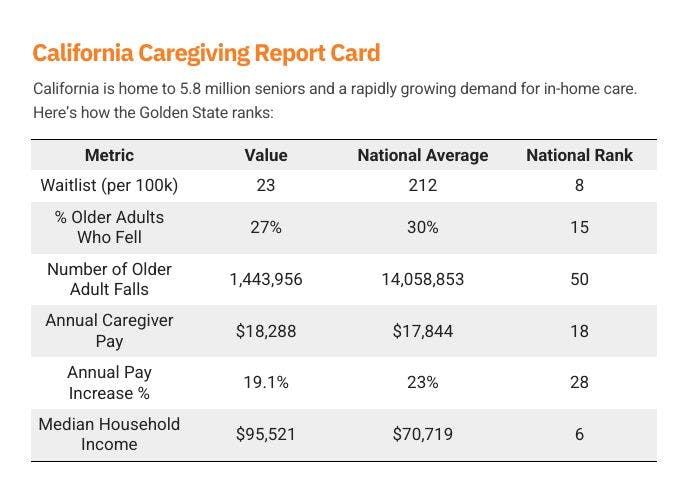
California has one of the shortest waitlists in the nation and pays caregivers competitively. Still, the relative financial benefit is modest due to the state’s high median income. With nearly 1.5 million older adults in California experiencing falls annually, expanding access to in-home care is not just a benefit—it’s a public health necessity.
Strengths in California's Caregiving System
1. Relatively Short Waitlists for In-Home Care are Still Too Long
California boasts one of the nation's shortest waitlists for in-home care services, with only 23 individuals per 100,000 residents on the waitlist, compared to the national average of 212. This efficiency suggests relatively effective management and prioritization in addressing the needs of its aging population.
Still, the average Californian waits 3 or more months to formally begin the caregiving relationship, creating an often urgent safety and mental health impact on its most vulnerable residents.
2. Competitive Caregiver Compensation
Caregivers in California have the potential to earn an estimated $18,288 per year, which is almost $1,000 above the national average. This competitive pay reflects the state's recognition of the vital role caregivers play in supporting the elderly and individuals with disabilities.
Challenges and Areas for Improvement
1. High Incidence of Falls Among Seniors
Approximately 27% of Californians aged 65 and older reported experiencing a fall in the past year, slightly below the national average of 27.8%. However, the sheer number translates to nearly 1.5 million seniors affected annually. Notably, over half a million older Californians fall more than once each year, with many not seeking medical attention or receiving fall prevention counseling.
2. Modest Annual Pay Increases for Caregivers
Despite competitive base pay, caregivers in California experience an average annual pay increase of 19.1%, which is below the national average of 23.0%. This slower growth may impact long-term retention and the attractiveness of caregiving as a sustainable career path.
3. Financial Strain on Family Caregivers
Family caregivers in California often face significant out-of-pocket expenses, averaging $7,000 annually. These costs encompass medical supplies, home modifications, and other caregiving-related expenses. Such financial burdens can lead to caregivers dipping into personal savings or reducing retirement contributions, highlighting the need for supportive policies and financial assistance programs.
Policy Recommendations for a Sustainable Future
To enhance California's caregiving infrastructure and support its aging population:
- Expand Fall Prevention Programs: Implement community-based initiatives focusing on balance training, home safety assessments, and public awareness campaigns to reduce fall-related incidents.
- Support Family Caregivers Financially: Speed the time to approval for paid family caregiving. Introduce tax credits or stipends to alleviate the financial burdens faced by unpaid family caregivers, ensuring they have the resources needed to provide quality care.
- Invest in Caregiver Training and Career Development: Offer continuous education and certification programs to professionalize caregiving, leading to better job satisfaction and improved care quality.
- Enhance Data Collection and Research: Strengthen data systems to monitor caregiving trends, identify gaps in services, and inform evidence-based policy decisions.
California's proactive approach in certain areas sets a commendable example. However, addressing the highlighted challenges through targeted policies and investments will be crucial in ensuring a robust and compassionate caregiving system for all residents.
Waitlist Inequality: Which States Are Failing—and Which Are Leading—on Access to In-Home Support
Waitlist Inequality: Which States Are Failing—and Which Are Leading—on Access to In-Home Support
For families in need of in-home care, where you live can determine whether help arrives in weeks—or years. Across the U.S., Medicaid’s Home- and Community-Based Services (HCBS) programs are essential to keeping seniors and people with disabilities out of institutions. But long waitlists in many states are forcing families to go it alone without pay, training, or respite.
Here’s how states compare:
Waitlists By State

Texas tops the list of longest waitlists with more than 1,000 people per 100,000 residents waiting for care—despite being home to over 4 million seniors. Families can be left waiting for years, often forced to reduce work hours or quit jobs to fill the gap.
No Waitlists, Ranked by Total Population
Not all states fall short. Eleven states—including large, diverse ones like New York, Arizona, and Massachusetts—report zero individuals on their HCBS waitlists as of 2024. These states demonstrate that a well-funded and efficiently managed system can provide timely, equitable care.
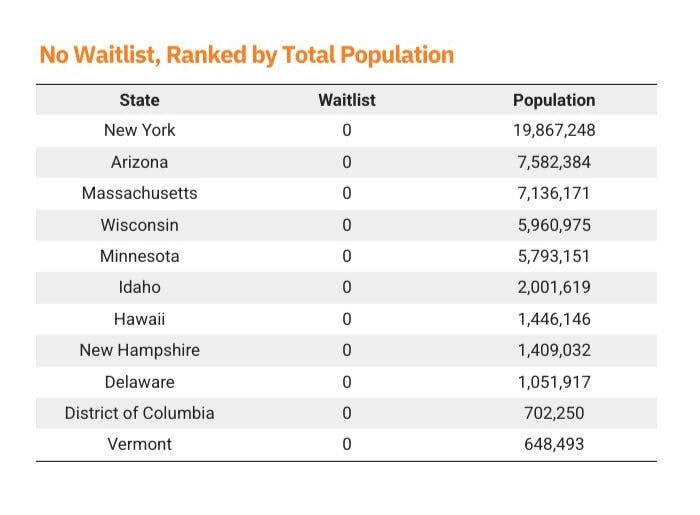
These no-waitlist states represent a mix of large and small populations, urban and rural settings, suggesting that strong performance is possible across a variety of conditions when political will and funding align
Why This Matters: Delayed Care Is Costly and Dangerous
Across the U.S., more than 656,000 individuals are currently stuck on HCBS waitlists, according to KFF. Many face delays of two to four years. For people with disabilities, that average wait climbs to 50 months, based on data from McKnight’s Home Care. Even in states with "typical" processing times, the application and approval process can take three months or more, per Medicaid Planning Assistance.
These delays have real consequences. Without timely support:
- Family members are often forced to leave their jobs, depleting household income and retirement savings.
- Older adults risk institutionalization or hospitalization due to falls, unmanaged conditions, or isolation.
- The long-term cost to the healthcare system escalates due to preventable emergency interventions.
Senior Fall Rates: How Prompt and Accessible Care Helps
Senior Fall Rates: How Prompt and Accessible Care Helps
Falls are the leading cause of injury-related death in Americans over 65. The CDC reports that each year, 3 million older adults are treated in ERs for fall injuries. But access to in-home care—like help with mobility, bathing, and medication—can reduce these risks.
The following are the states where short waitlists are correlated with lower than average fall rates, as well as the states where long waitlists are accompanied by greater than average fall rates.
No & Low Waitlist States with Fall Rates Below the National Average
Long Waitlist States with Fall Rates Above the National Average
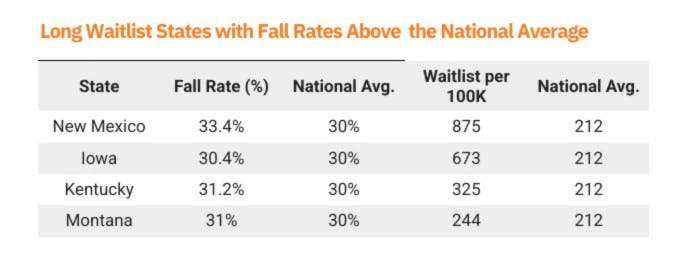
The connection is clear: states with lower fall rates often maintain accessible caregiving systems. Where waitlists are long, seniors are more likely to suffer preventable injuries—often leading to hospitalization or nursing home admission. In-home care isn’t just compassionate. It’s preventative health care.
Where Caregiving Pay Makes the Biggest Impact
Where Caregiving Pay Makes the Biggest Impact
Caregiving work is often unpaid and undervalued—even costing caregivers over $7,000 on average every year in unplanned expenses. In many states, adding even part-time wages for caregiving can make a significant difference to a family’s finances.
We used Zip Recruiter’s data on the average hourly wages for in-home family caregivers in each state and multiplied that by the average amount of caregiving hours worked (100 per month), and compared that to the latest Census reported median incomes in each state.
The below section outlines the potential annual pay increase percentage if caregiving wages were readily available to careers.
The Potential Income Boost from Caregiving Wages
Top 5 & Bottom 5 States: Income Boost from Caregiving Wages
In lower-income states, caregiving pay is a lifeline—boosting household income by over 25% in many cases. But most caregiving is unpaid. According to AARP, the average family caregiver provides over 18 hours/week and spends $7,200 annually out of pocket. Widening access to paid roles could ease both financial and emotional stress on families.
Conclusion: A Call to Action for States and Policymakers
Conclusion: A Call to Action for States and Policymakers
This report paints a clear picture: family caregivers are overburdened, underpaid, and often unsupported. Meanwhile, paid in-home care is proven to reduce falls, prevent hospitalization, and ease pressure on families—but access remains deeply unequal.
We must:
- Reduce administrative barriers to Medicaid-funded in-home care
- Compensate caregiving work at fair, livable wages
- Fund preventive support that keeps seniors safely at home
- Recognize family caregivers not just as loved ones, but as essential workers
America’s aging crisis isn’t looming—it’s here. If we want to meet it with dignity, equity, and sustainability, we must invest in the care economy now.
Methodology
Methodology
This report draws on publicly available data from federal, state, and third-party sources to assess how well each U.S. state supports family caregivers and their aging or disabled loved ones. The analysis incorporates multiple metrics, each selected to represent a distinct dimension of caregiving accessibility, compensation, or health outcomes. Here's how each data point was gathered and calculated:
Medicaid Waitlist Size, Adjusted for Population
Medicaid HCBS (Home- and Community-Based Services) waitlist data was collected from KFF (Kaiser Family Foundation). Because raw waitlist counts vary drastically based on state population size, we normalized the data by calculating the number of waitlisted individuals per 100,000 residents, using 2024 census population estimates. This adjustment provides a more equitable basis for comparing accessibility across states of varying sizes.
Estimated Annual Caregiver Pay
Readily sourcing average caregiver pay across all 50 states is difficult, given that compensation often varies by county and individual program structure. To address this, we used ZipRecruiter’s state-by-state averages for job titles commonly associated with home care roles. The figures were treated as proxies for hypothetical caregiver wages if such a paid role were made universally available.
To simulate potential income, we multiplied the hourly wage by 100 hours of care per month, which approximates the average number of paid caregiving hours provided in part-time Medicaid-based programs. This results in a hypothetical annual caregiver salary, allowing for comparative analysis across states—even where direct pay programs may not currently exist.
Median Income & Potential Pay Increase
We sourced median household income by state from the U.S. Census Bureau (most recent American Community Survey release). To illustrate the potential economic impact of being compensated for caregiving, we calculated the percentage increase over median incomes that potential caregiver pay could contribute to the median household income in each state.
Fall Rates Among Older Adults
To assess downstream health risks associated with lack of in-home care, we incorporated data from the CDC’s Behavioral Risk Factor Surveillance System (2020 release). This includes both the percentage of older adults who reported a fall in the past year and the estimated number of fall incidents per state. Falls remain a leading cause of hospitalization and long-term disability among seniors, and serve as a proxy for unmet care needs or insufficient home safety interventions.